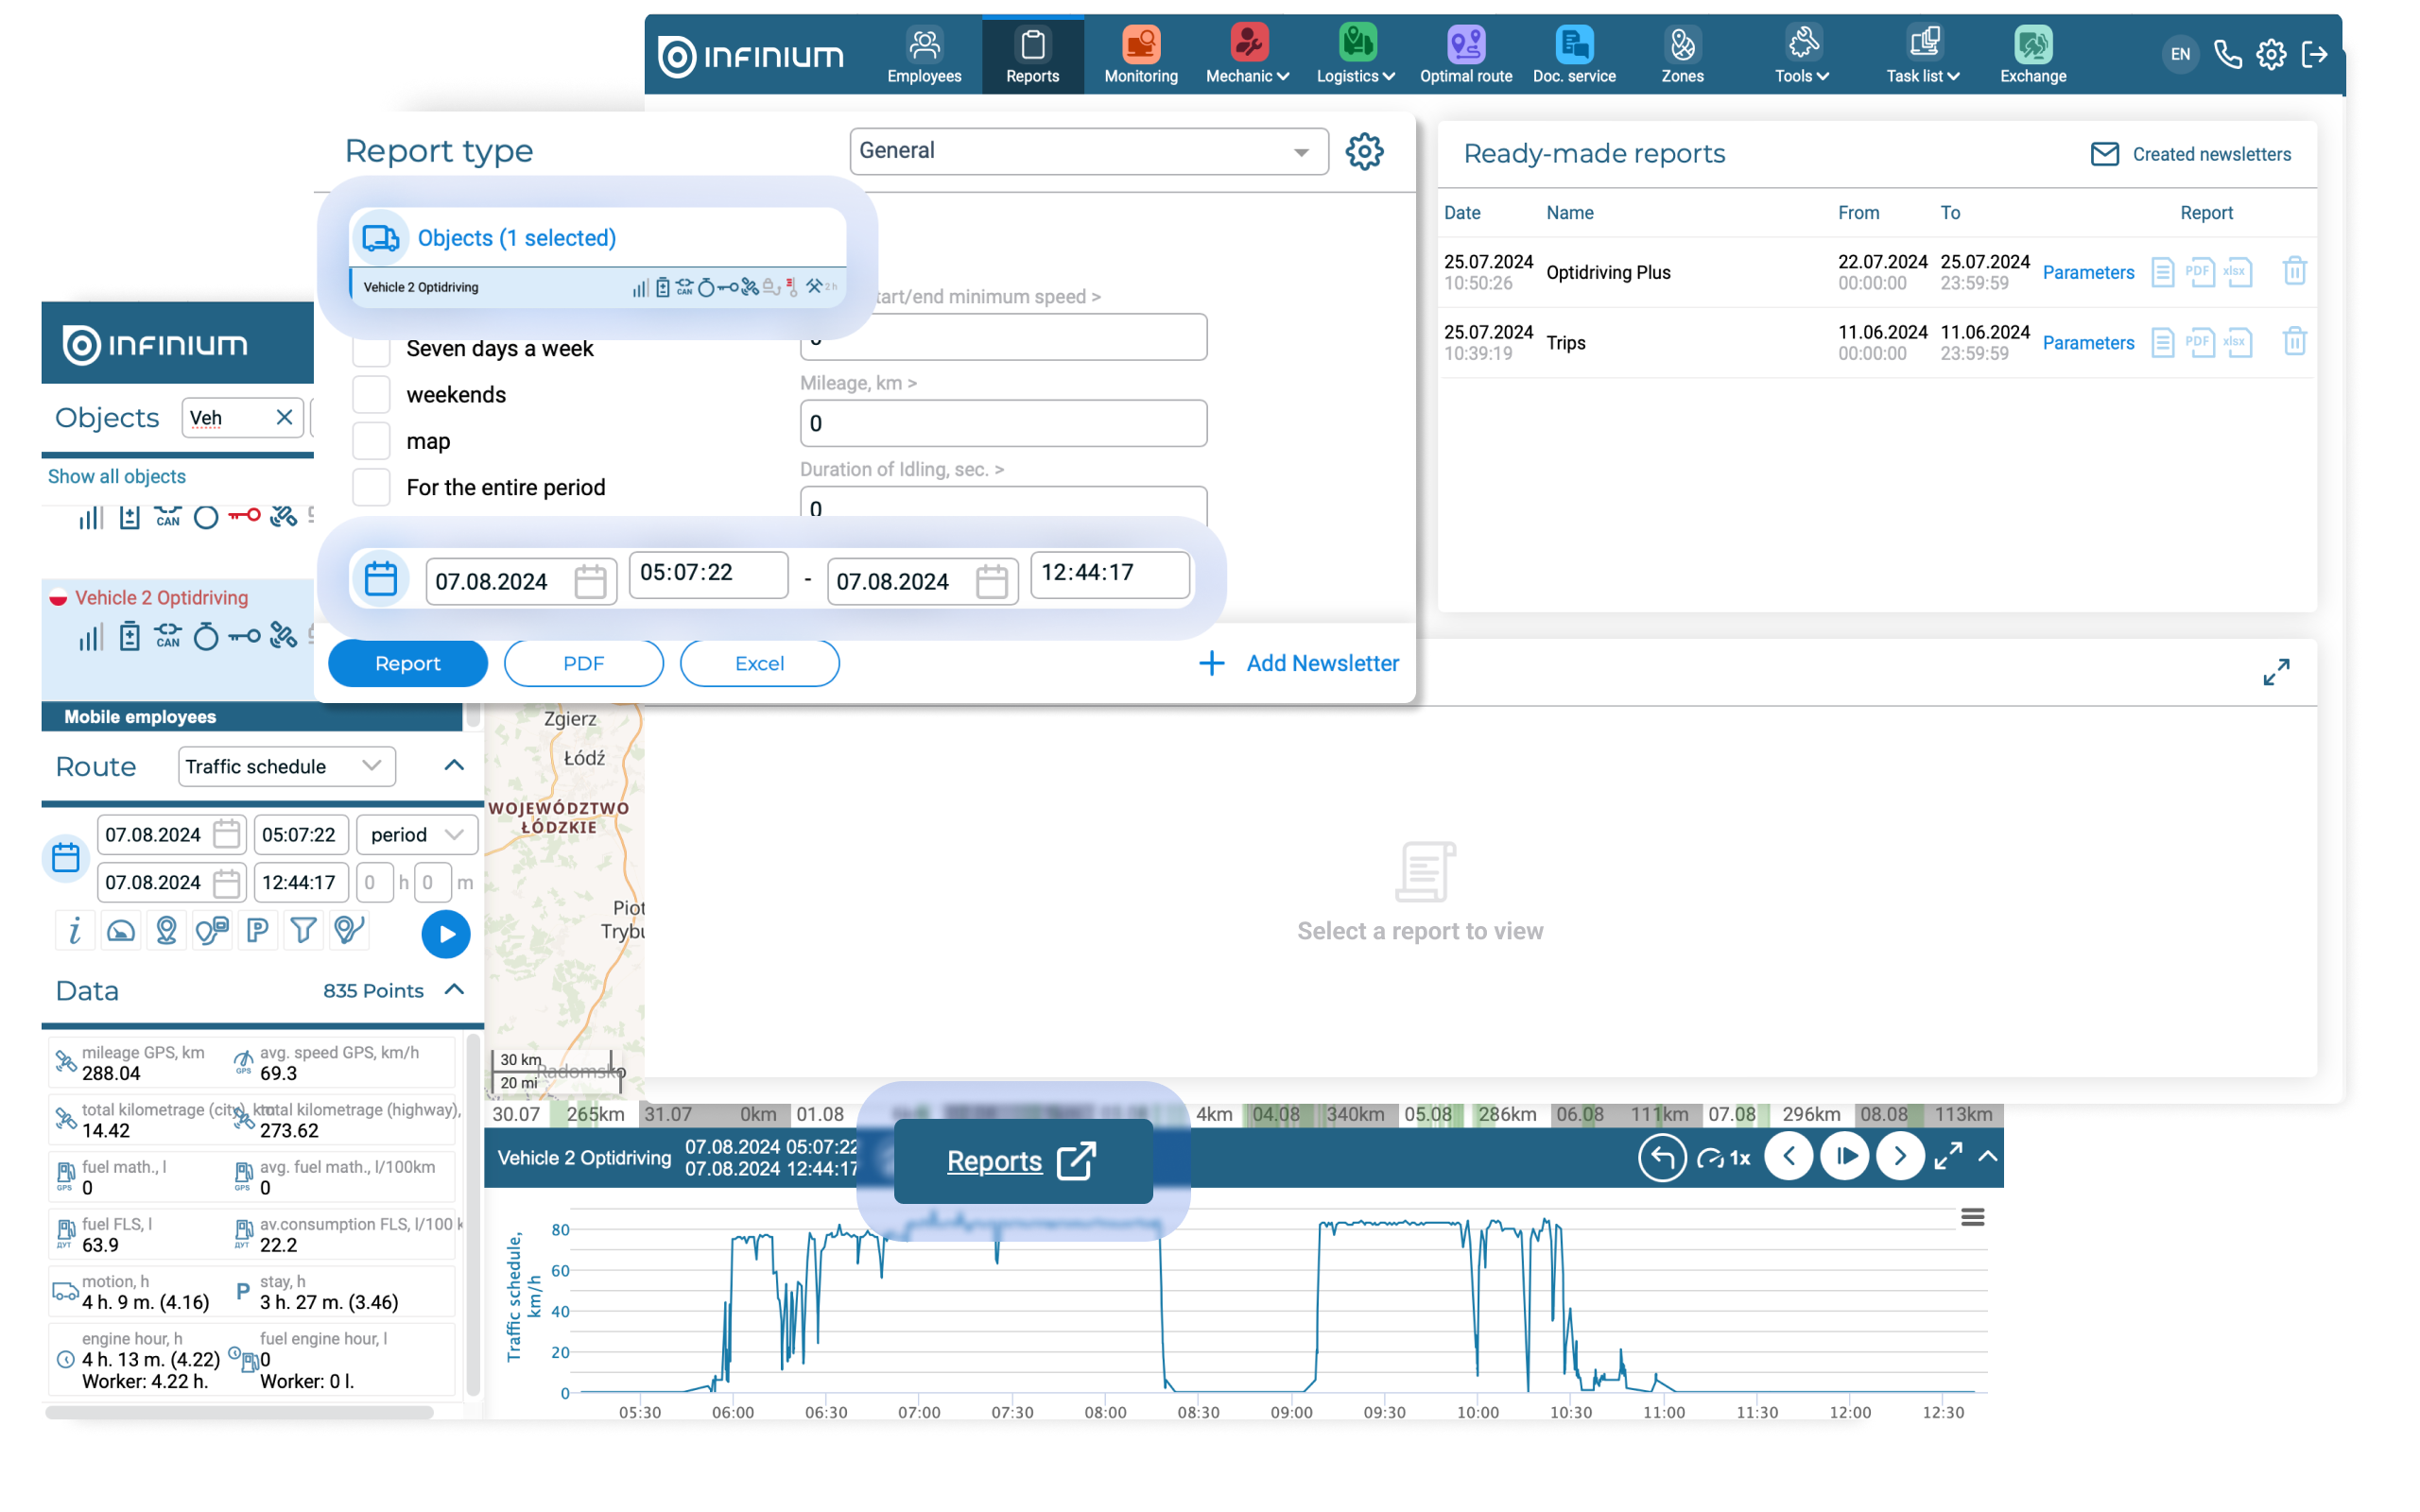
Section “Monitoring”
For the convenience of using our platform, the ability to directly switch from the “Monitoring” page to the “Reports” page with the selected vehicle and date period.
In “Monitoring” you can already get quick access to several types of reports:
▶ “Detailed” report (partially)
▶ “Telematics Ref” report
▶ CAN report (partial)
▶ “General” report (partially)
▶ Report “Machine hours (modes)” (in the data block)
However, the Platform contains an even larger number of reports, in addition to those mentioned above, which are used by users to monitor information on objects. To expand the functionality of quickly generating reports of any type from “Monitoring”, a “Reports” button was added.
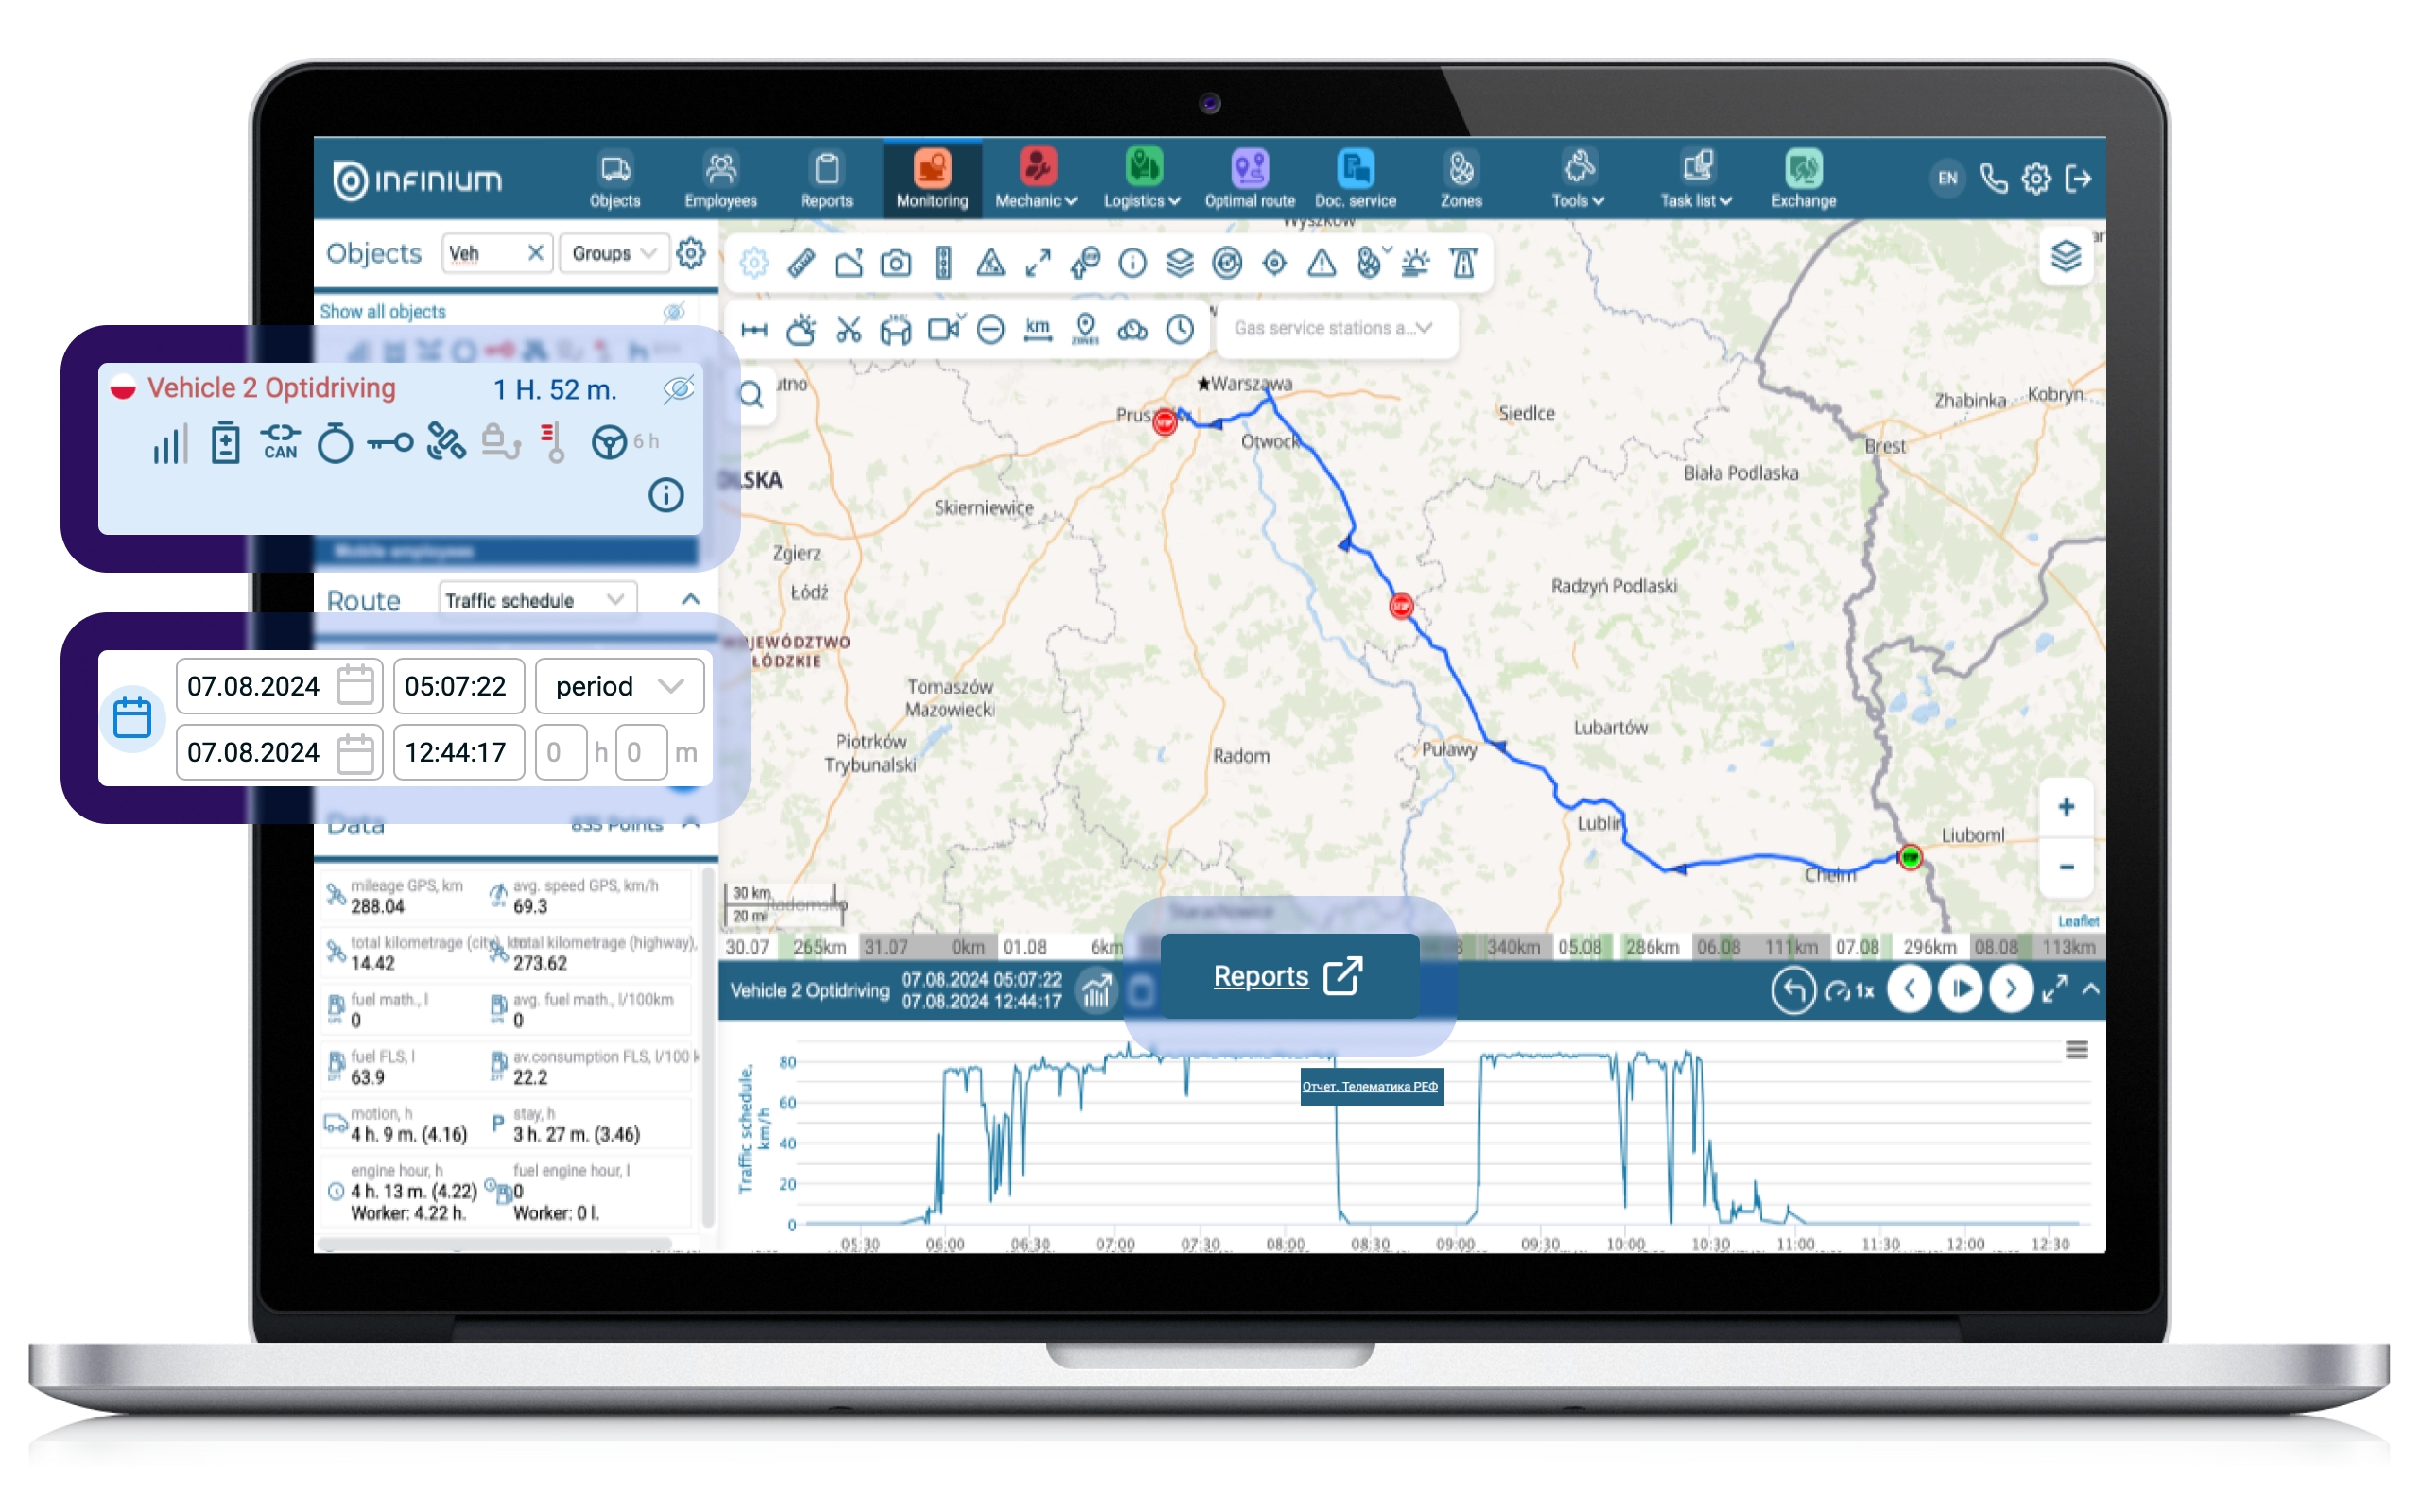
When you click on the button, you go to the “Reports” section with automatic filling of information on the object and period from the “Monitoring” section. The report type must be manually selected from the drop-down list.
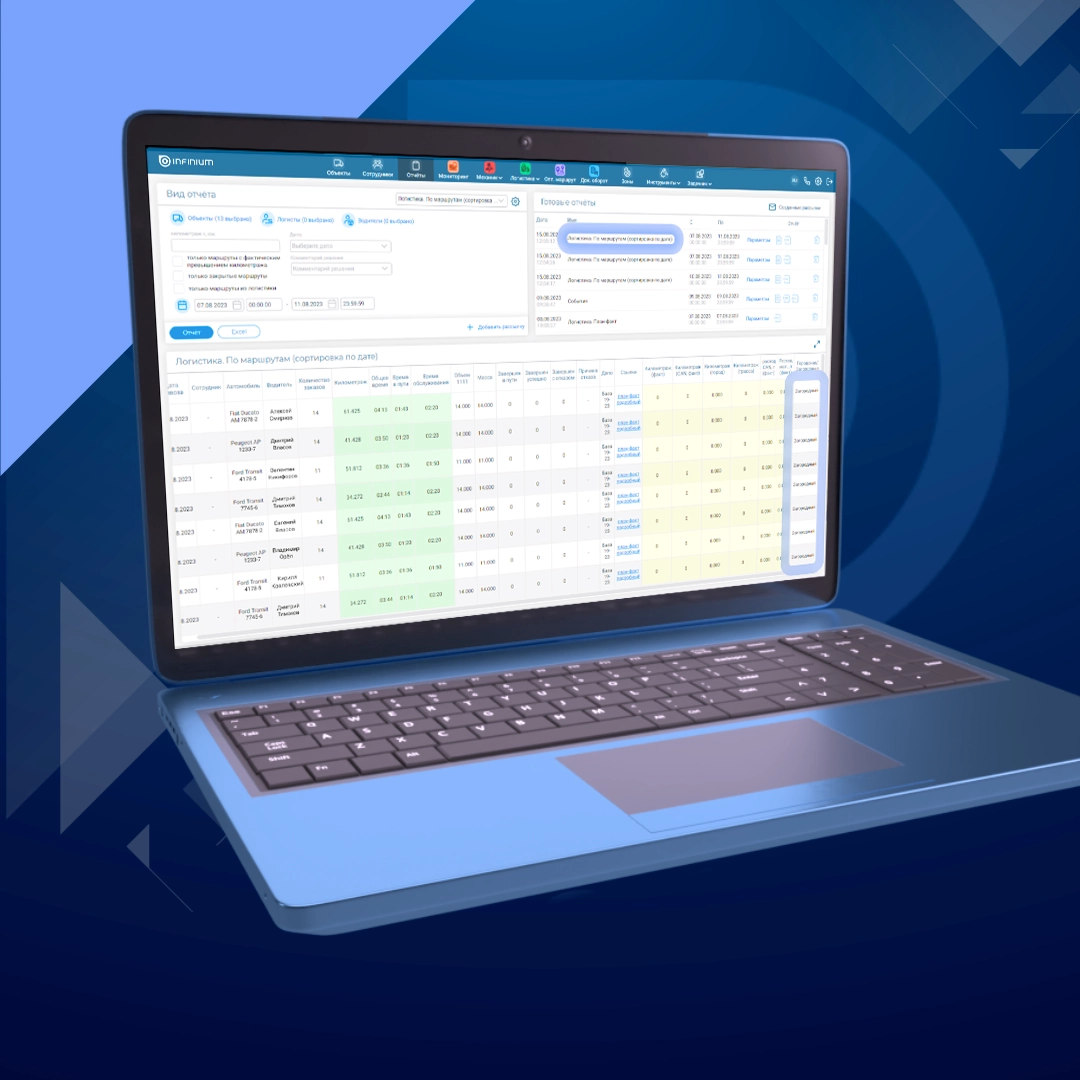
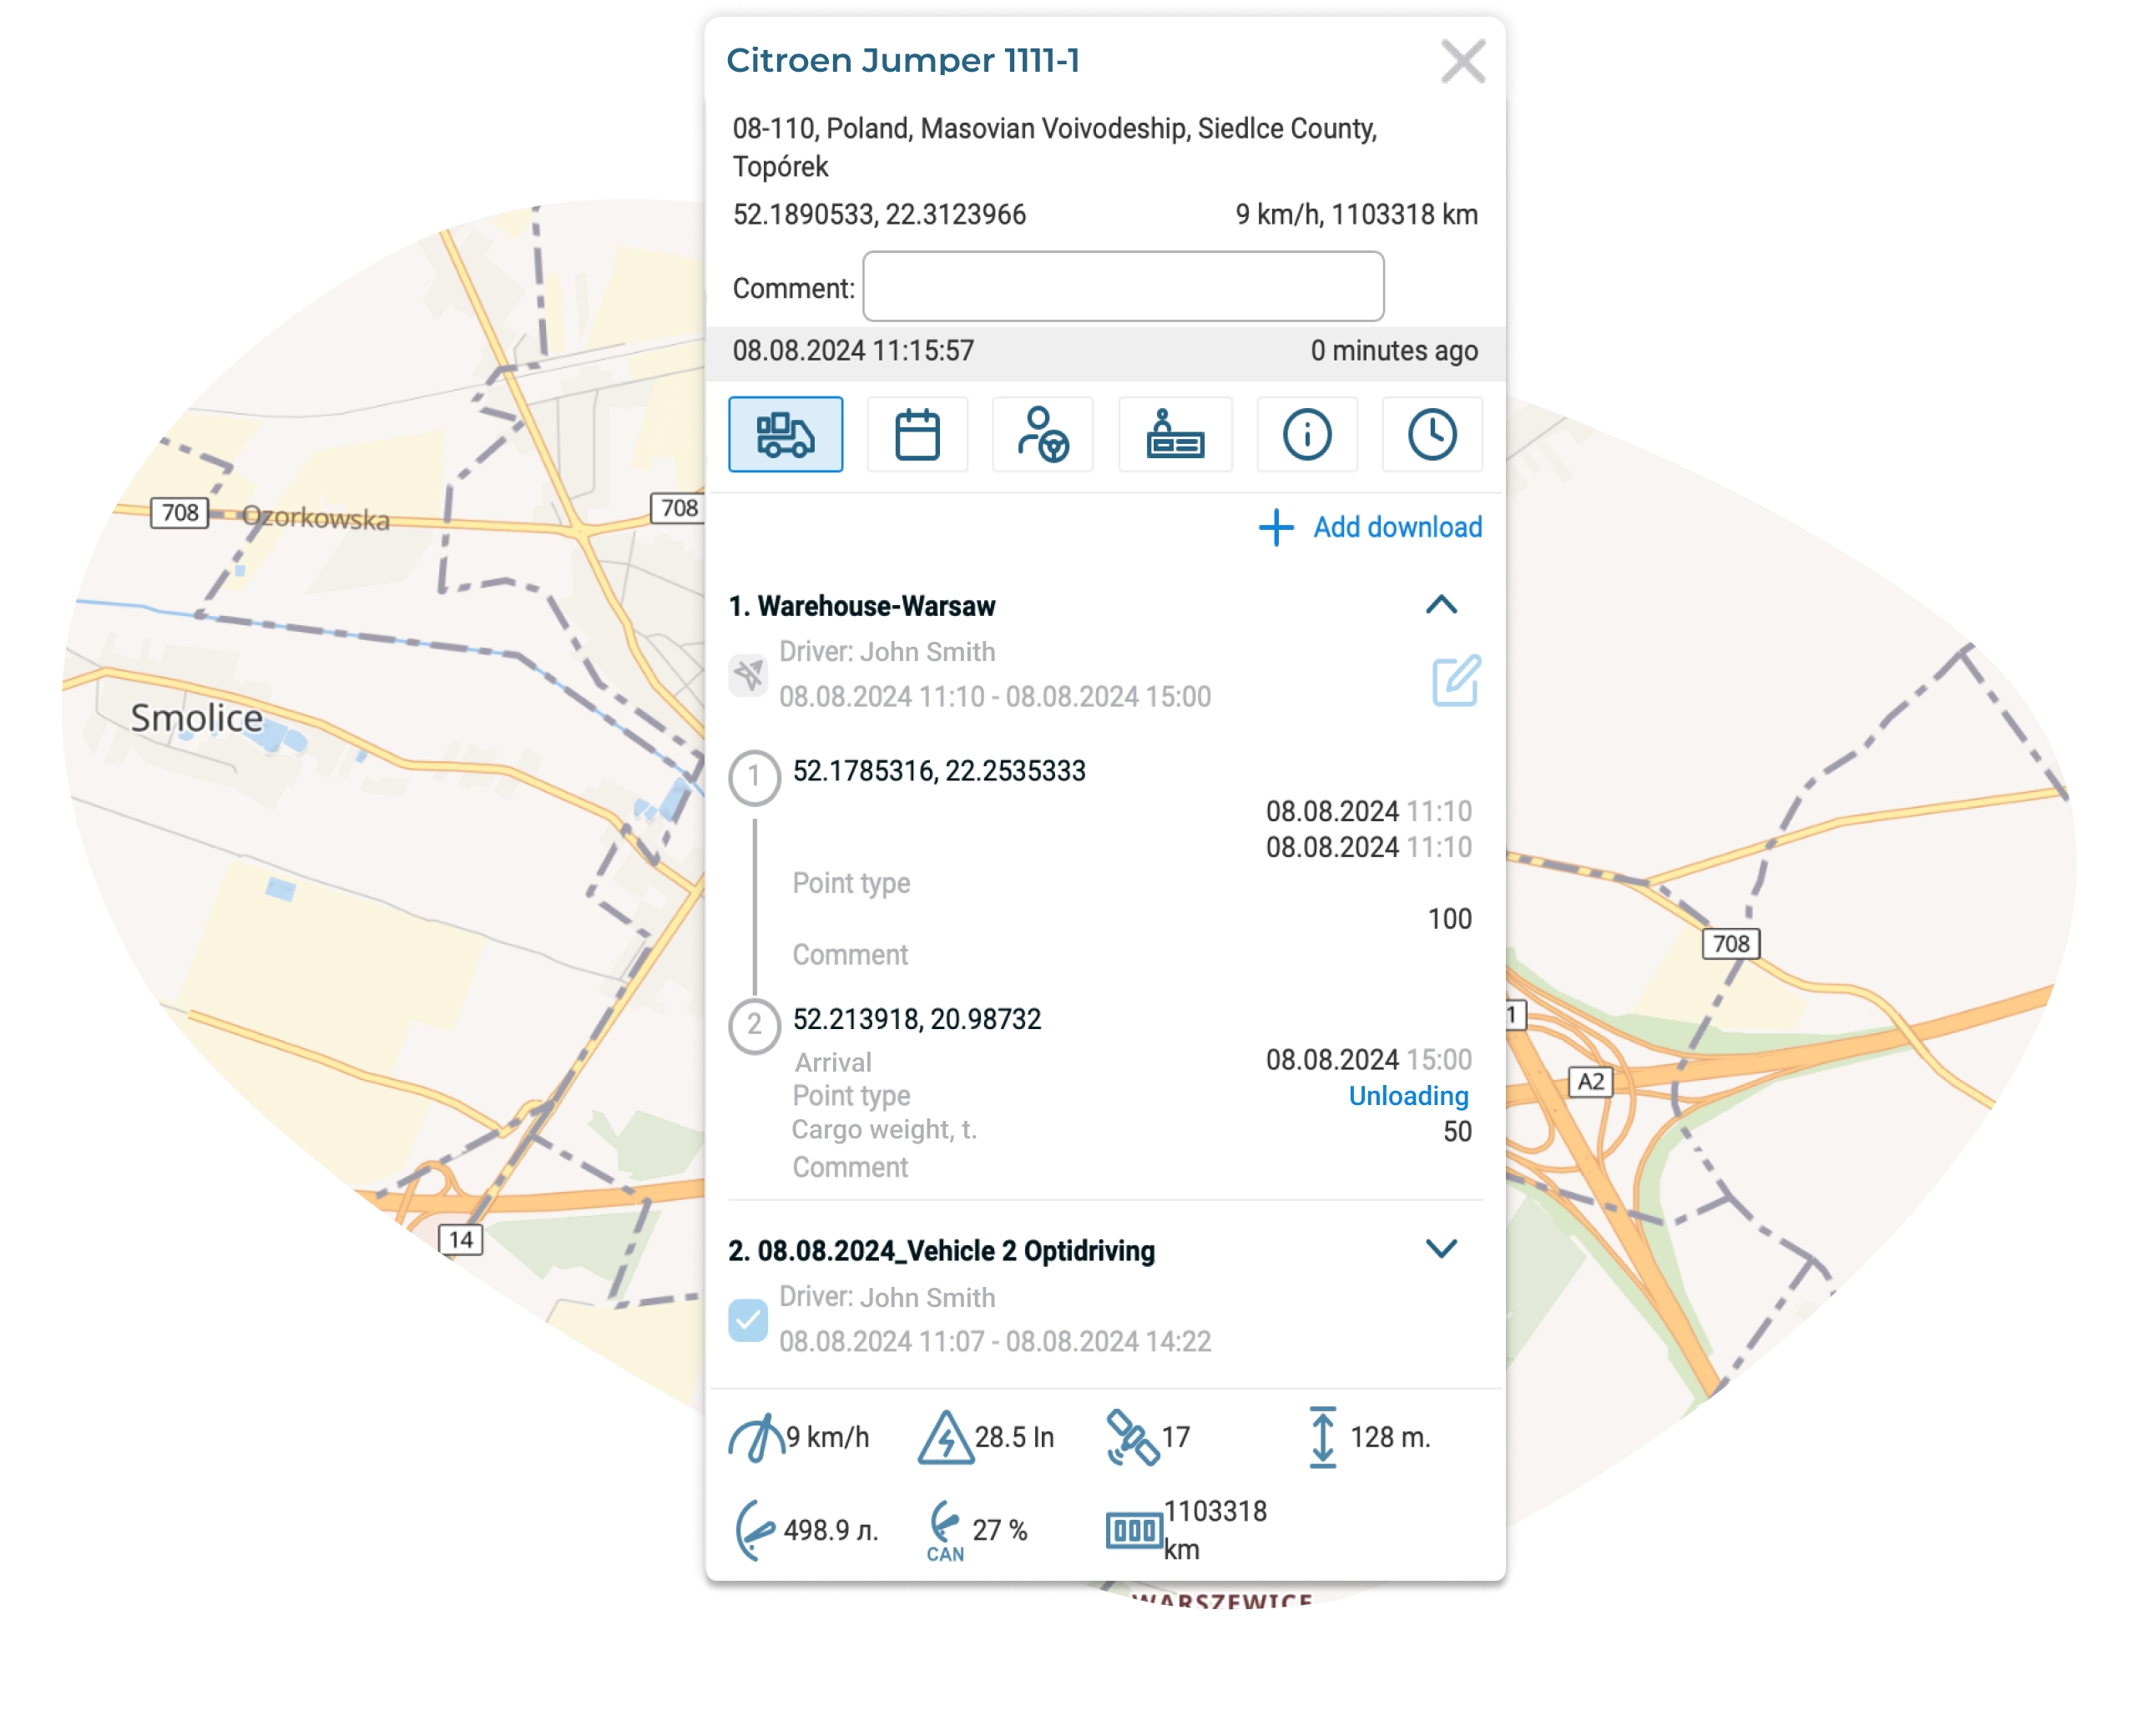
A designation has also been added for sent/delivered routes in the “Monitoring” information window.
The Downloads tab in the Monitoring information window allows users to see complete route information without having to navigate to the Optimal Route and Downloads sections. At the same time, when viewing such a route, it is important for a logistician to understand whether the driver has familiarized himself with the route, or whether we are talking about a draft version of the proposed route. As a result, it was decided to add the following designations to the list of routes:
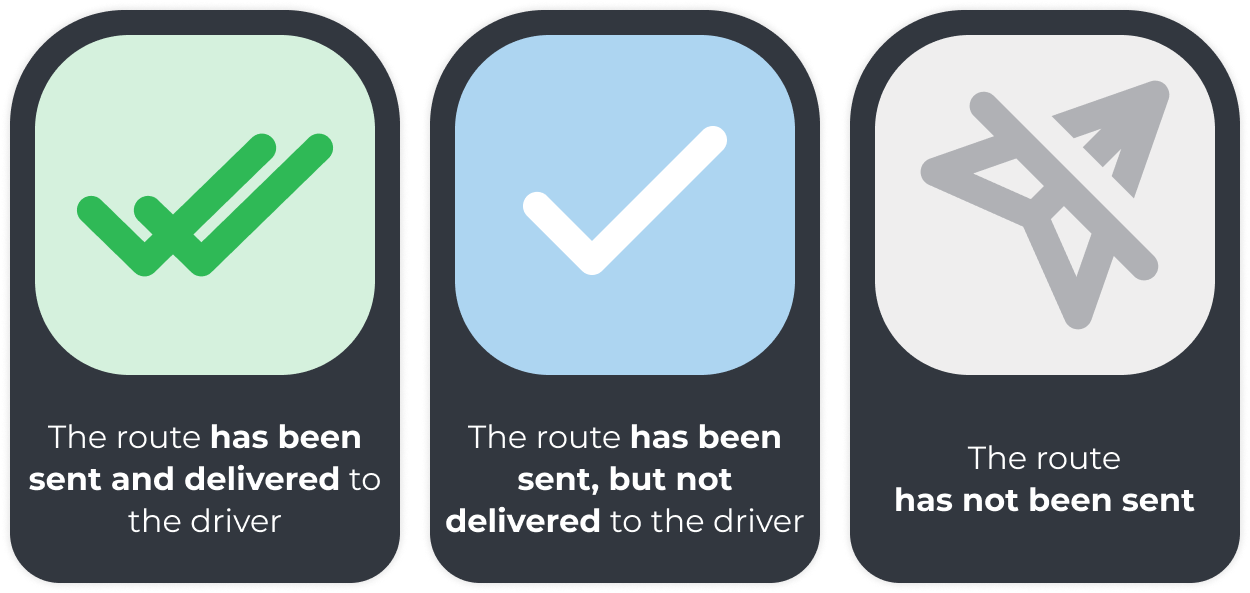
Thus, now in the “Monitoring” section, the logistician can see that a route to the selected object is still being planned or it is already ready for the driver to carry out.
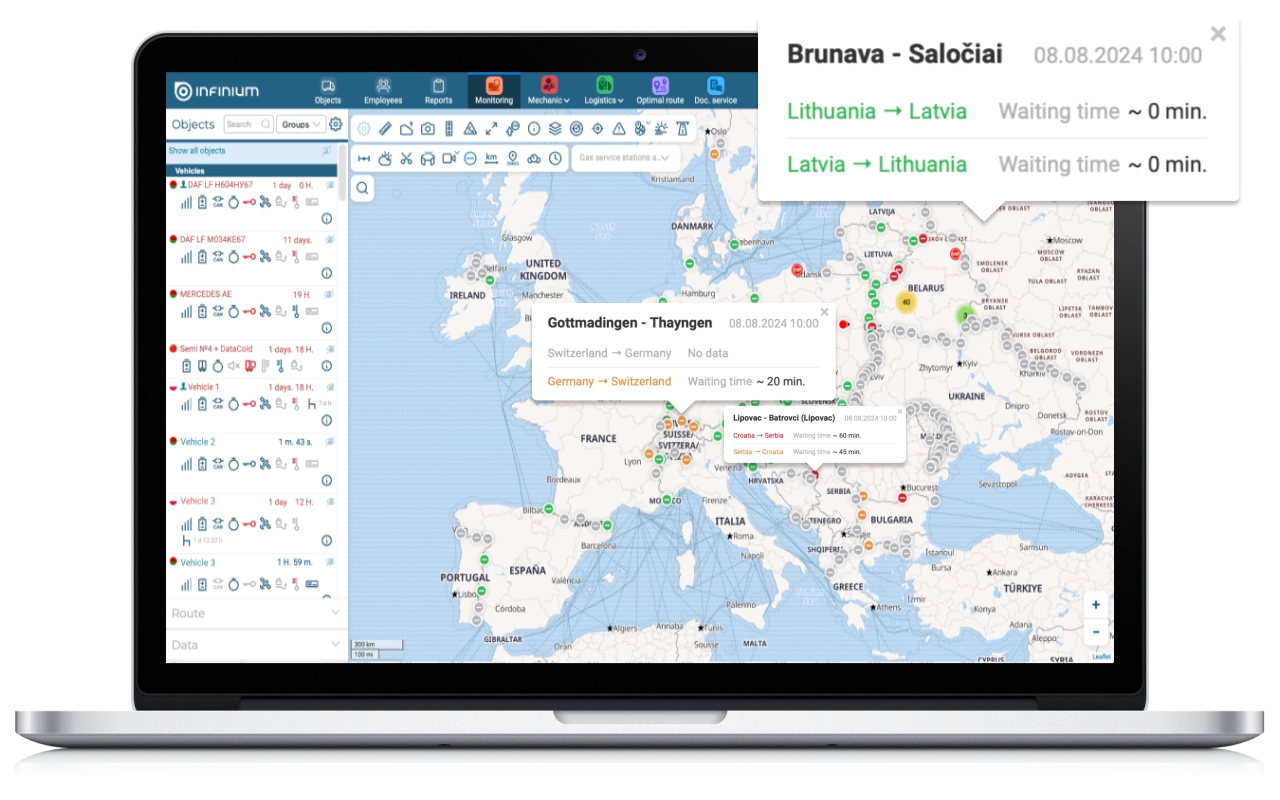
Information about border crossings has been updated
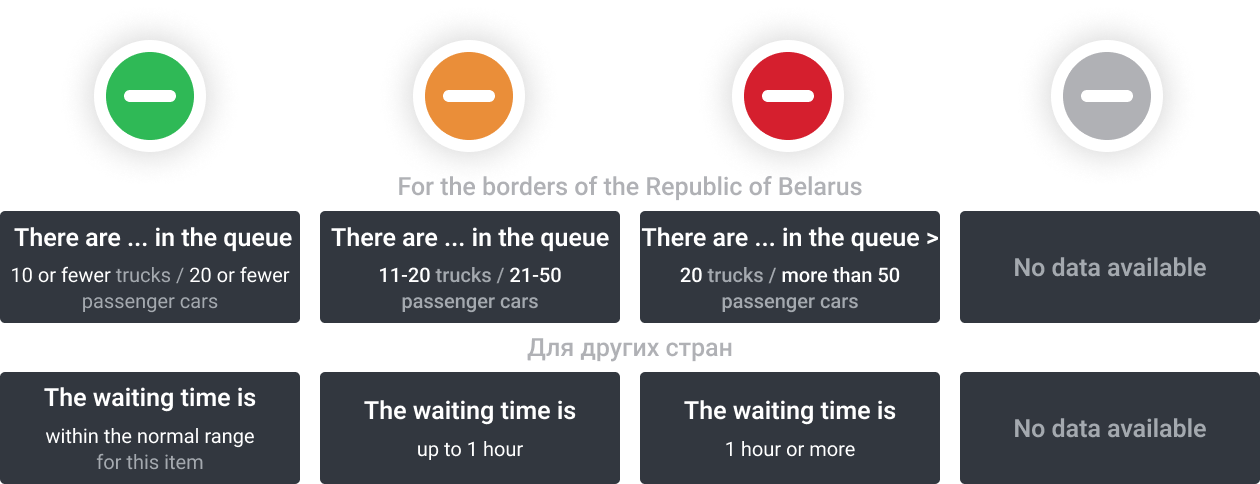
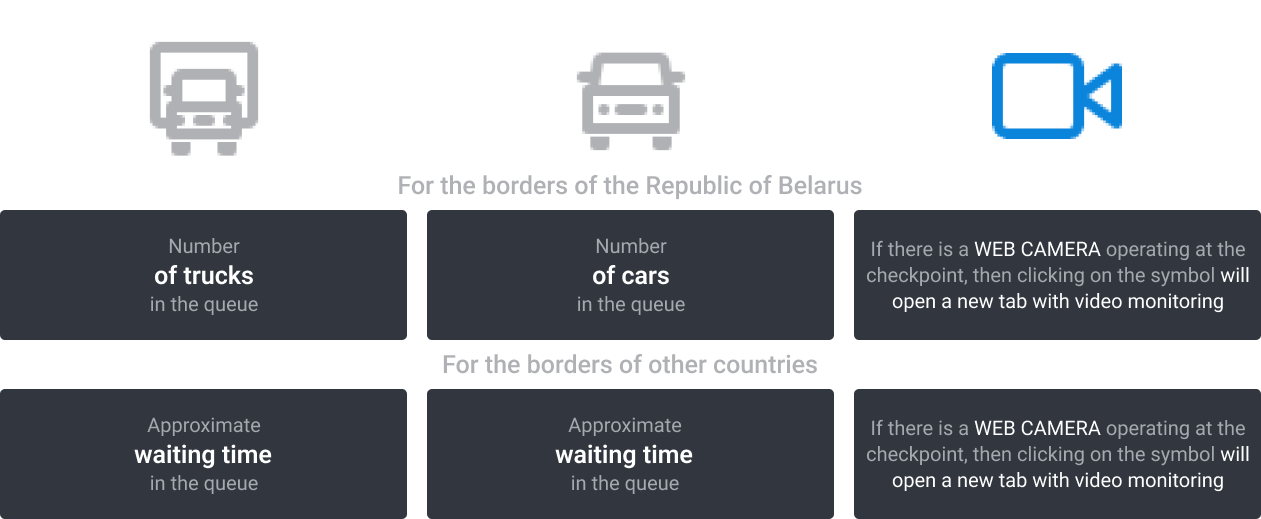
In the “Monitoring” section, users are provided with the “Checkpoints” tool, which displays border points included in the System on a map, and also allows them to find out current information about the number of cars and trucks in the queue for entry/exit or the required waiting time.
For better visual perception of information, as well as increasing its semantic content, the icons of checkpoints were redesigned, and information on their placement was updated. Now markers are displayed in different colors depending on the waiting time at the border crossing and the availability of congestion data.
Detailed information about the border crossing, as well as the degree of its congestion, is placed in a special tooltip that appears when you hover the cursor over the required checkpoint. The tooltip contains the following information about the date and time the queue data was last updated:
Section “Logistics”
To create repeat intervals, a convenient functionality of the “Logistics” section was developed
For some users, the delivery process is structured in such a way that one driver in one car completes several routes per day, stopping at the warehouse after each of them. Previously, in this situation, it was necessary to manually create each of these routes separately or perform optimization based on several delivery waves (1st and 2nd half of the day, morning-afternoon-evening, etc.). Any of these methods required significant labor costs for the logistician and increased cost of the delivery plan due to the lack of end-to-end optimization.
To automate this process, a method was developed for constructing routes in the “Logistics” section, according to which, with the active optimization parameter “Several routes for 1 car”, a solution is automatically built with repeated departures of one car from the depot. In this case, the chain of routes of one vehicle is saved as one route with returns to the depot.
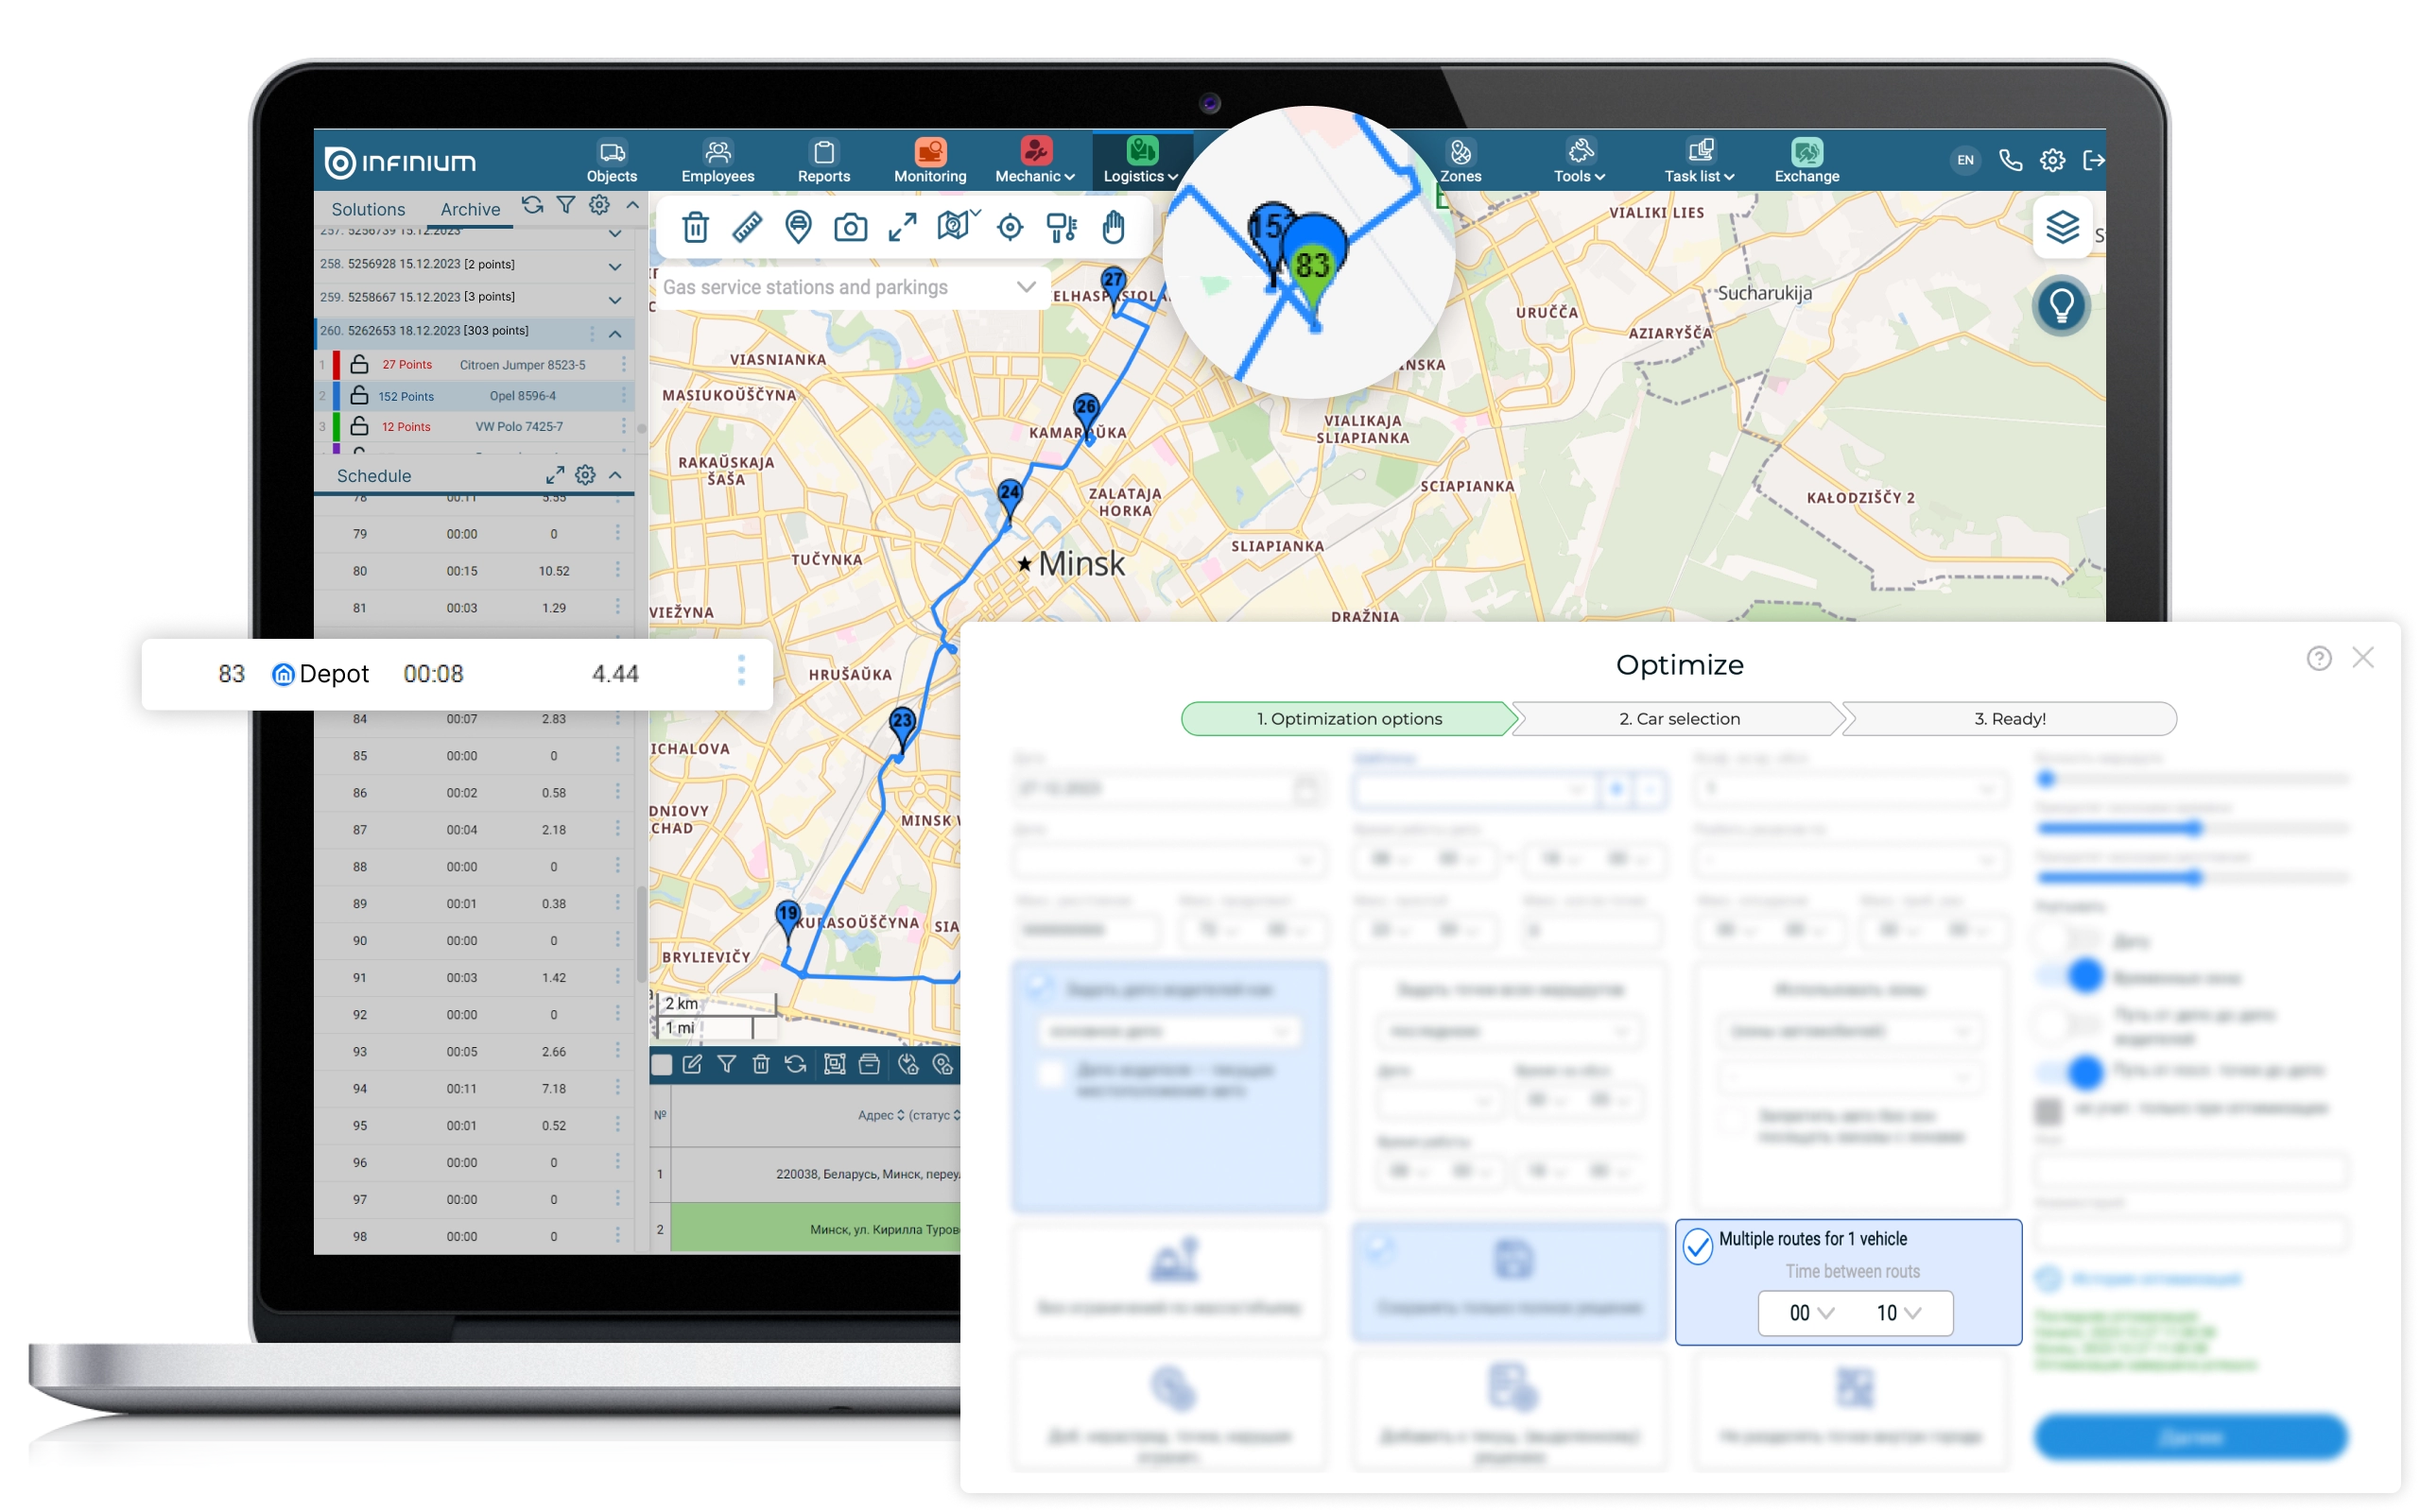
The algorithm for accounting for repeat intervals allows you to create mathematically accurate optimal solutions for the following industries:
▶ Retail – when supplying stores with goods, the driver, as a rule, manages to make up to 3-4 trips per day with three to five orders per trip
▶ Garbage collection – a garbage truck makes many repeated trips per day with the same structure (landfill – city – landfill)
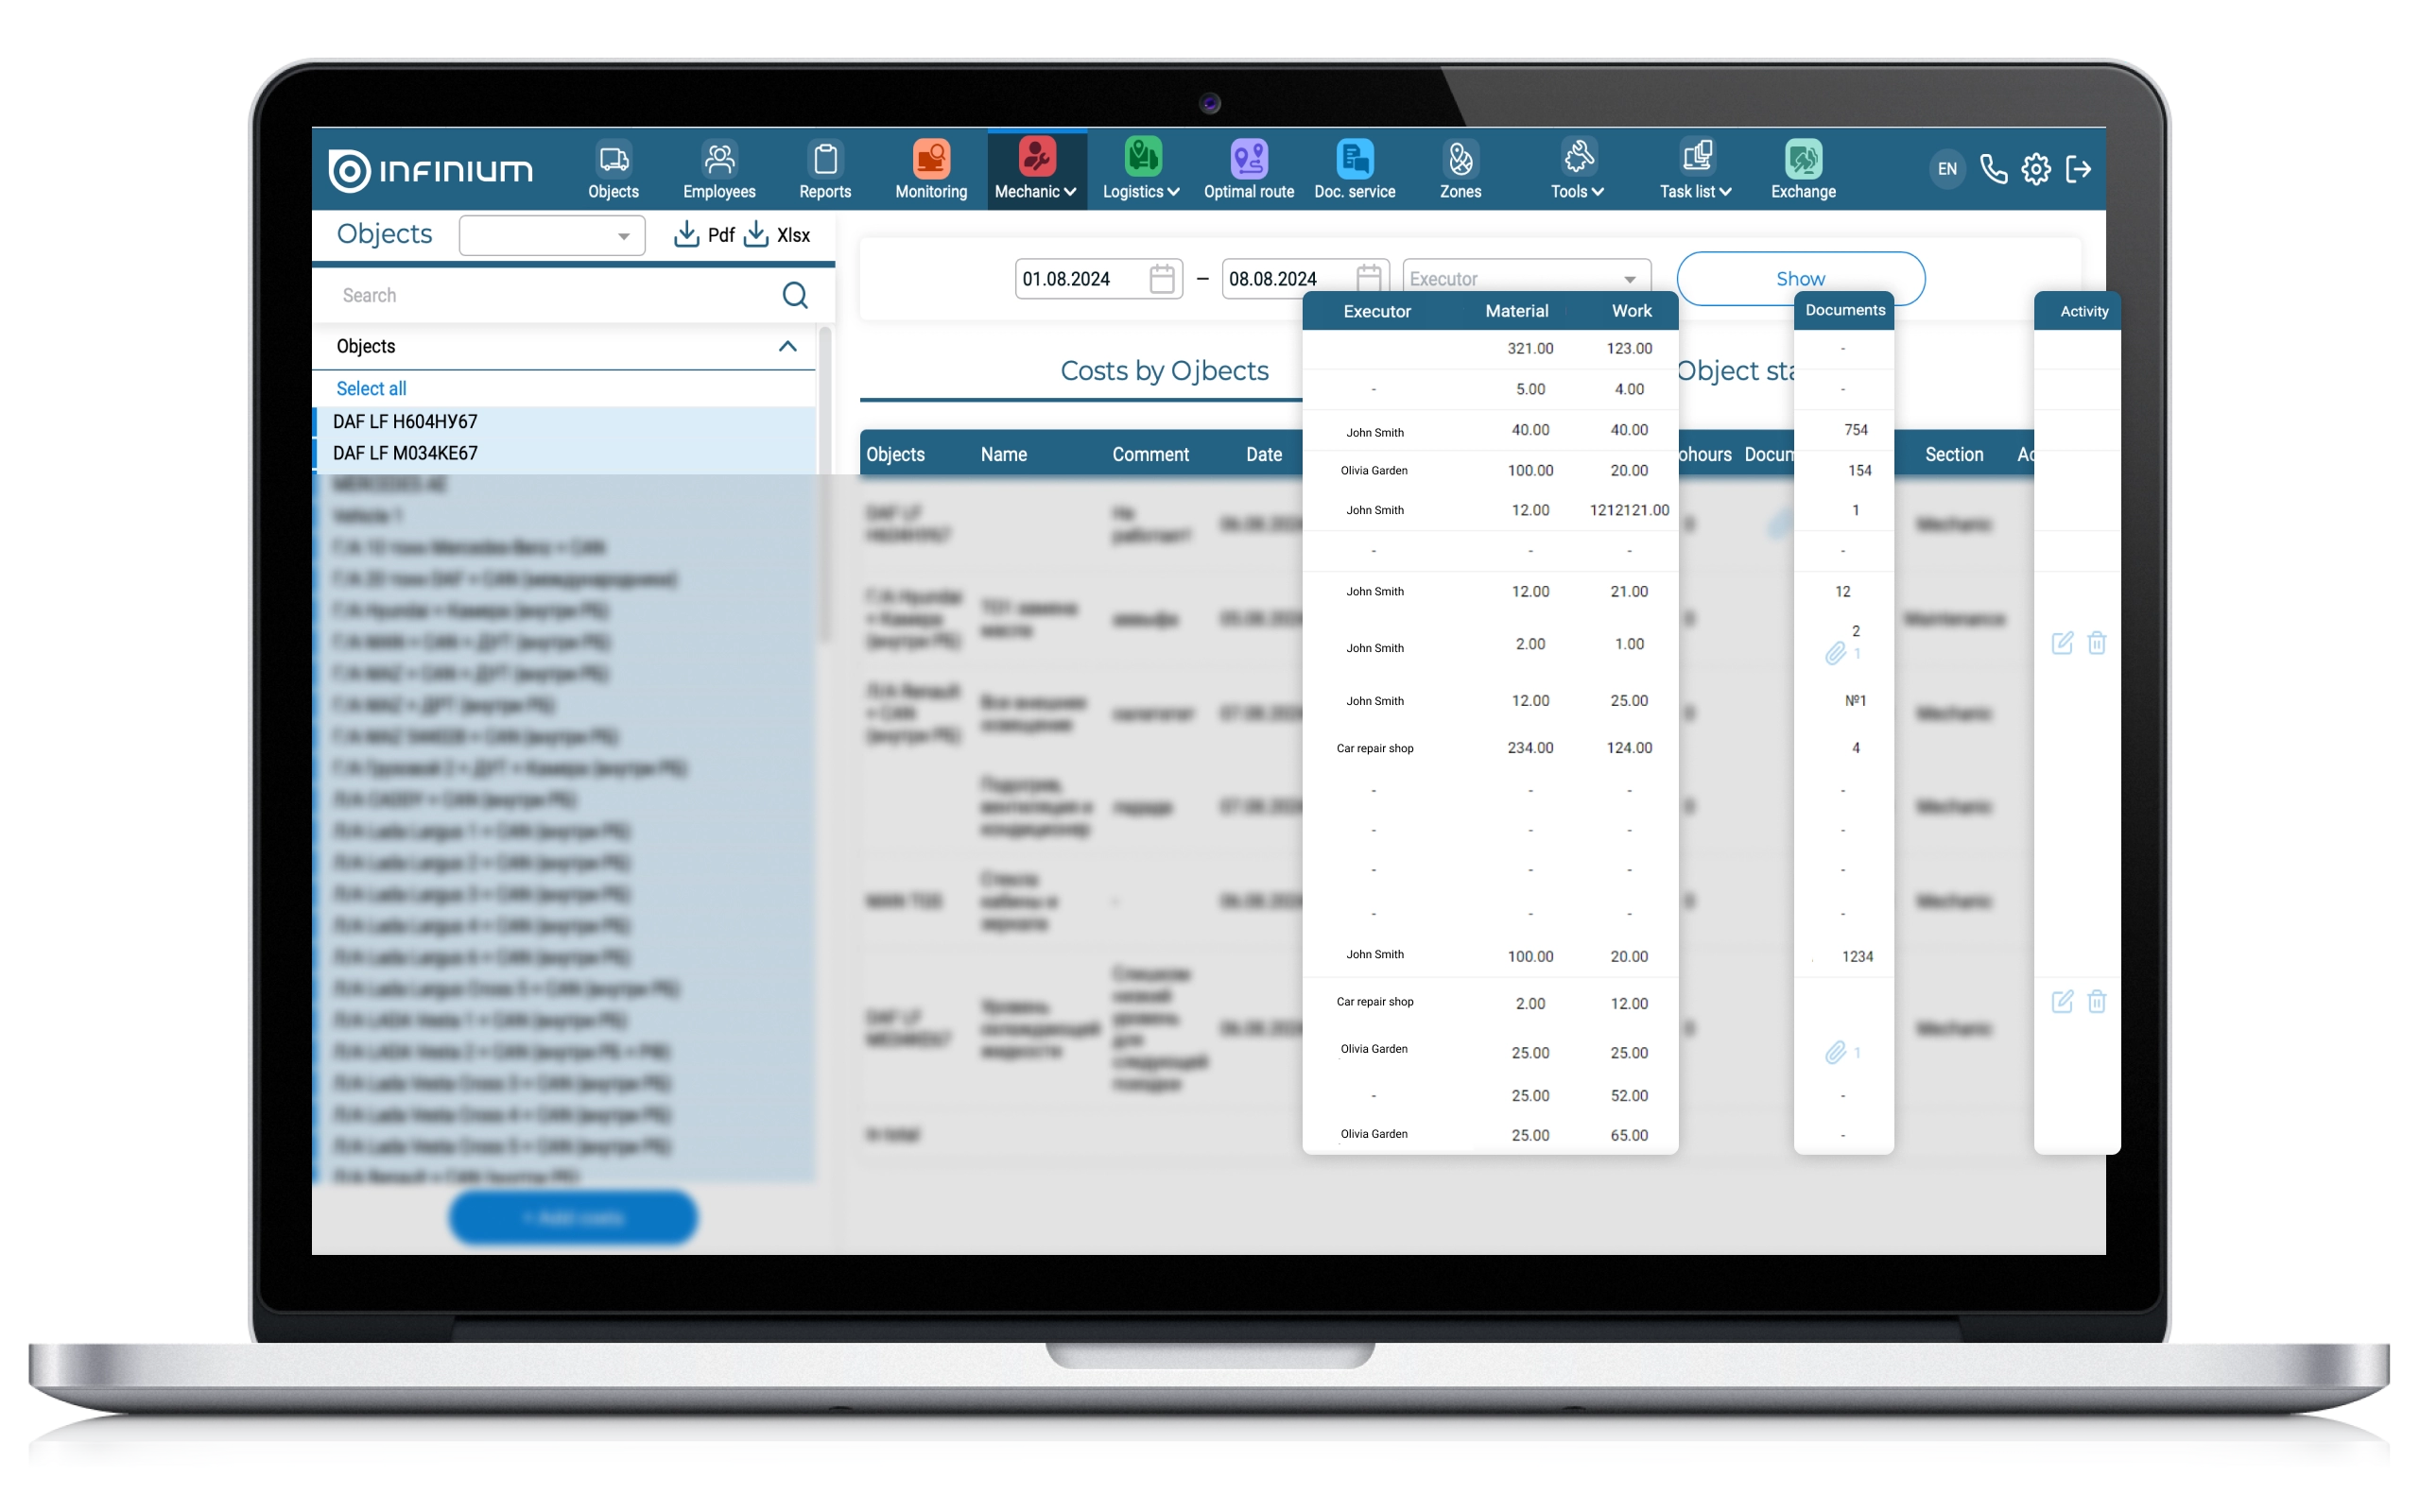
The ability to record the cost and performer in the “Mechanic” / “Maintenance” / “Costs” sections was also added.
High-quality maintenance of information on recorded car faults and their elimination is one of the most important functions of a mechanic. The platform provides a convenient interface for maintaining such records – “Fault Log”. In the log you can record the car, the name of the fault, the driver who noted the fault, the date of detection and elimination, as well as add a detailed comment and attach a photo. However, an important point is planning the costs of repairs, as well as the location of the repairs – this can be either your own repair yard or a third-party service station. Thus, fields have been added to the “Fault Log” to indicate the planned or actual cost of work and materials; the Contractor field to indicate the employee or the place of repair, as well as the ability to attach documents with reporting information on the work performed. In this case, the table can be filtered by Contractor, object and date, and also the selected information can be uploaded to Excel to provide a list of faults as a request to a service station for repair work.
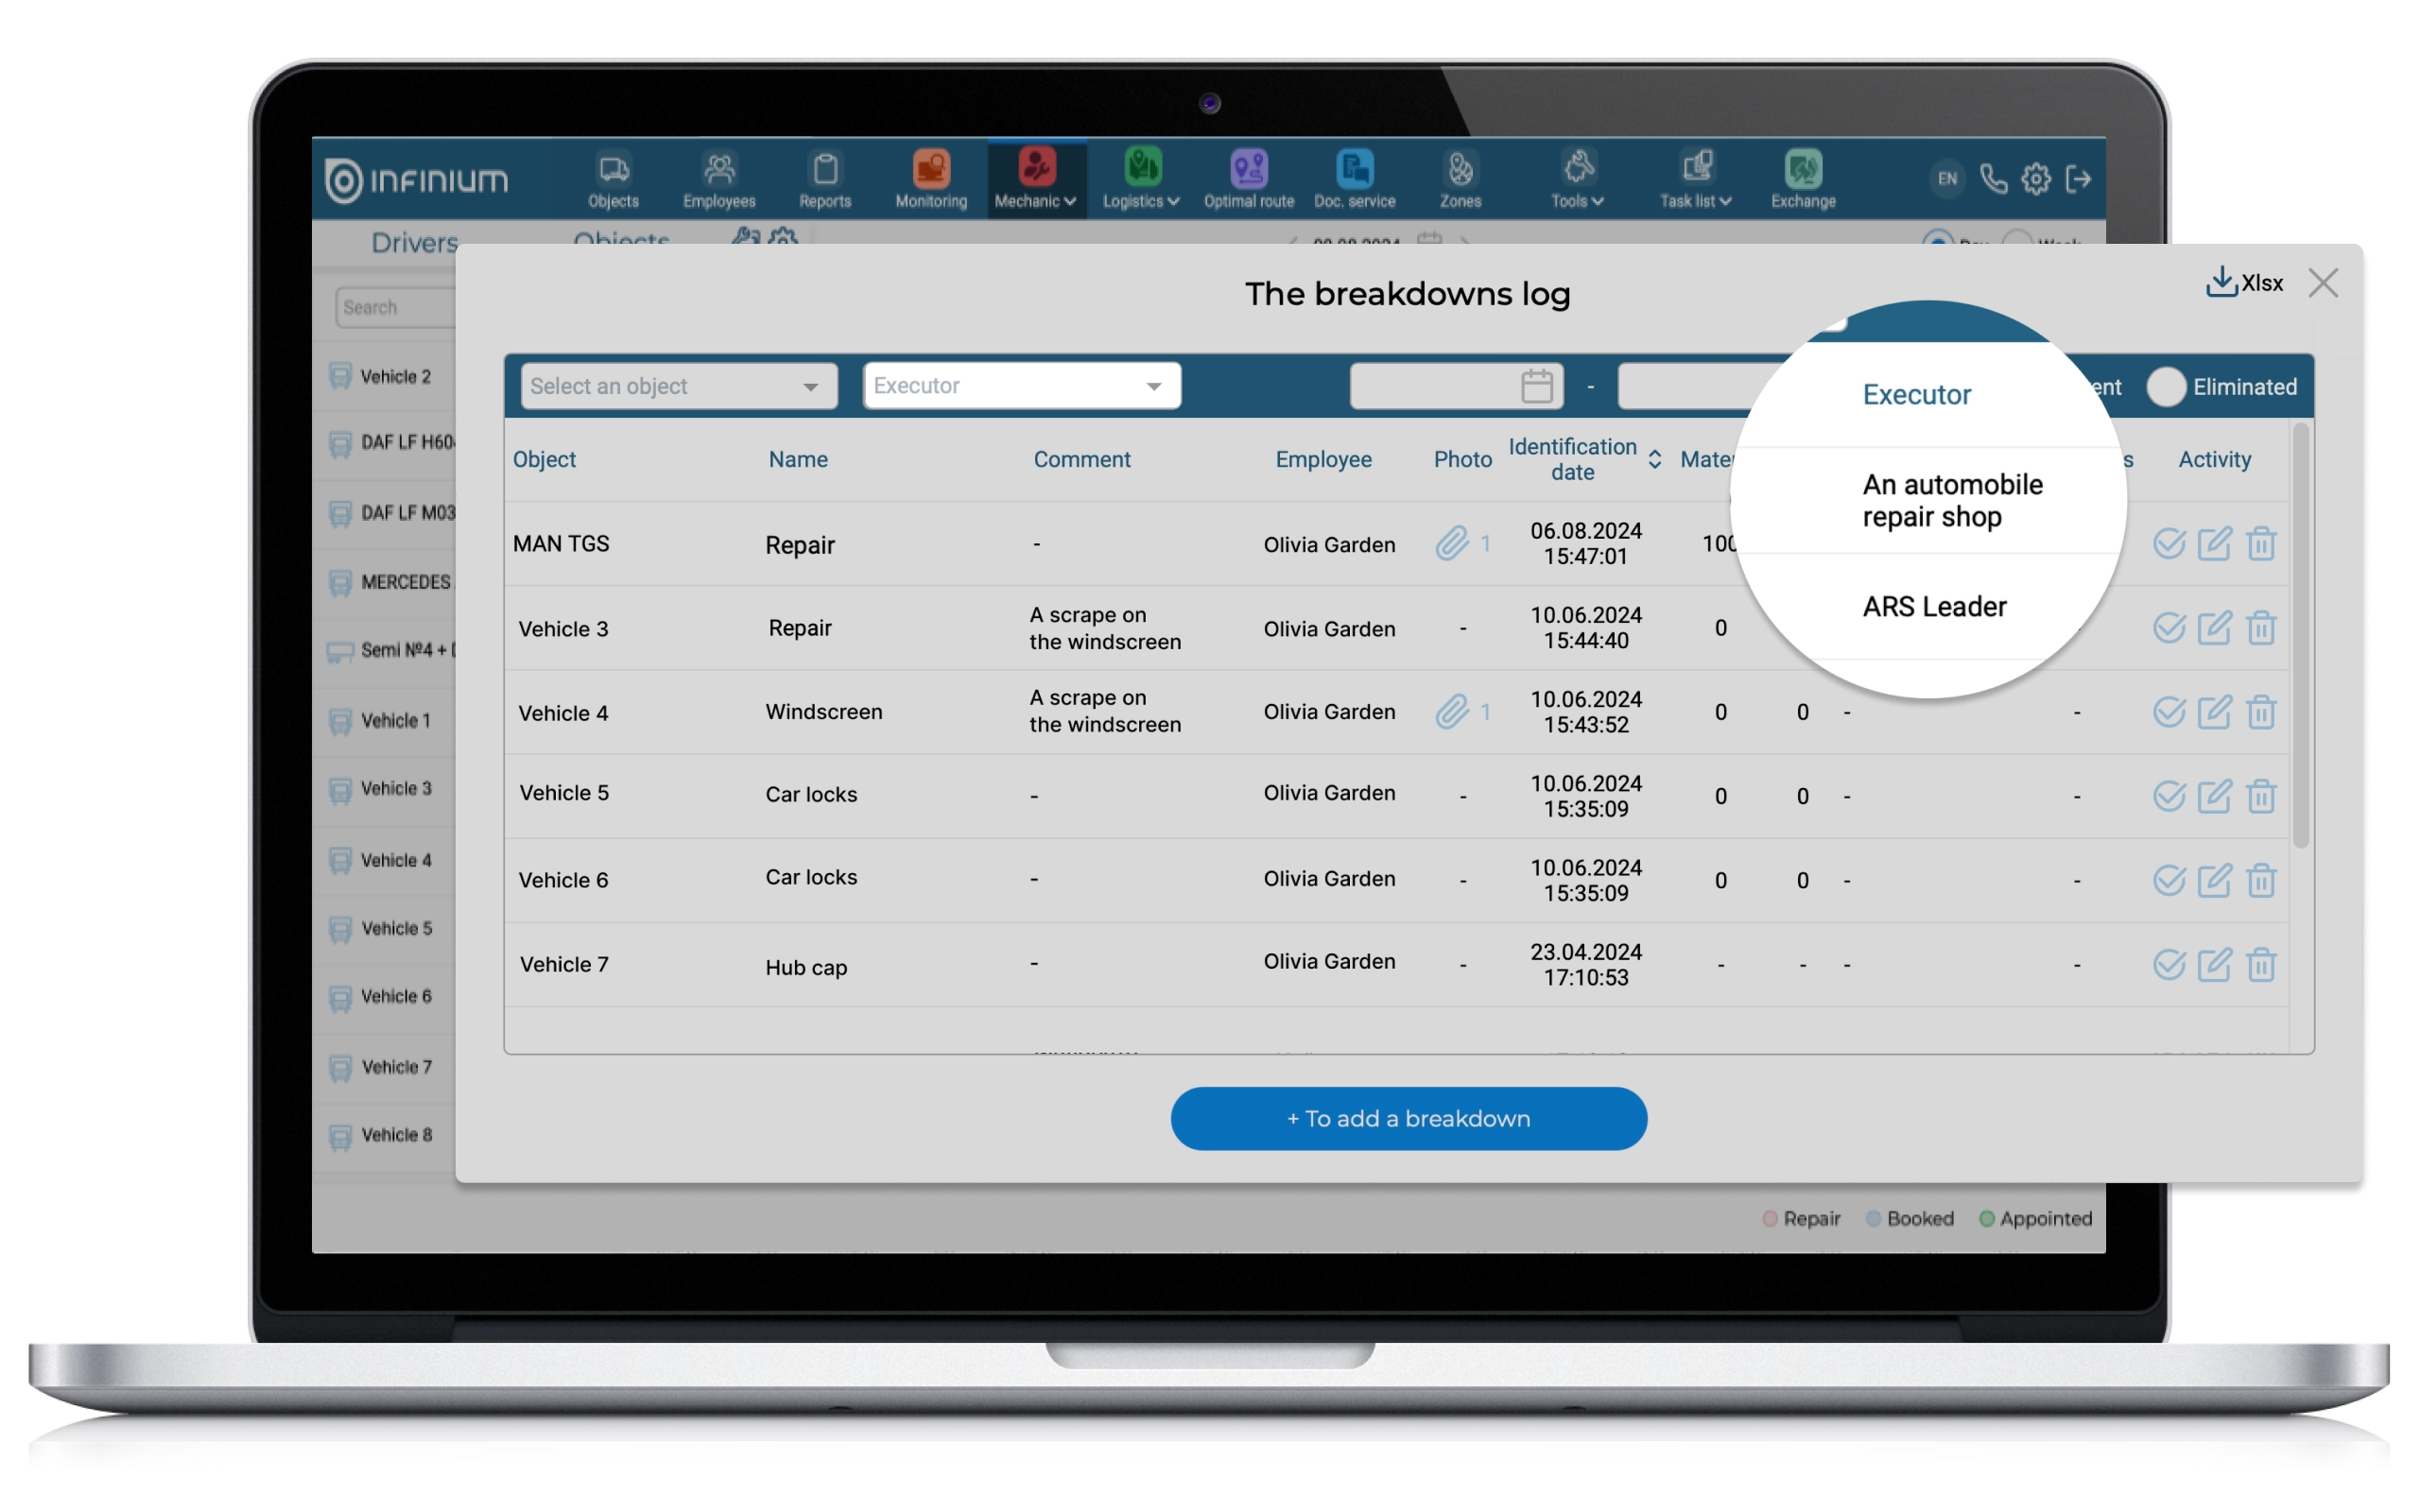
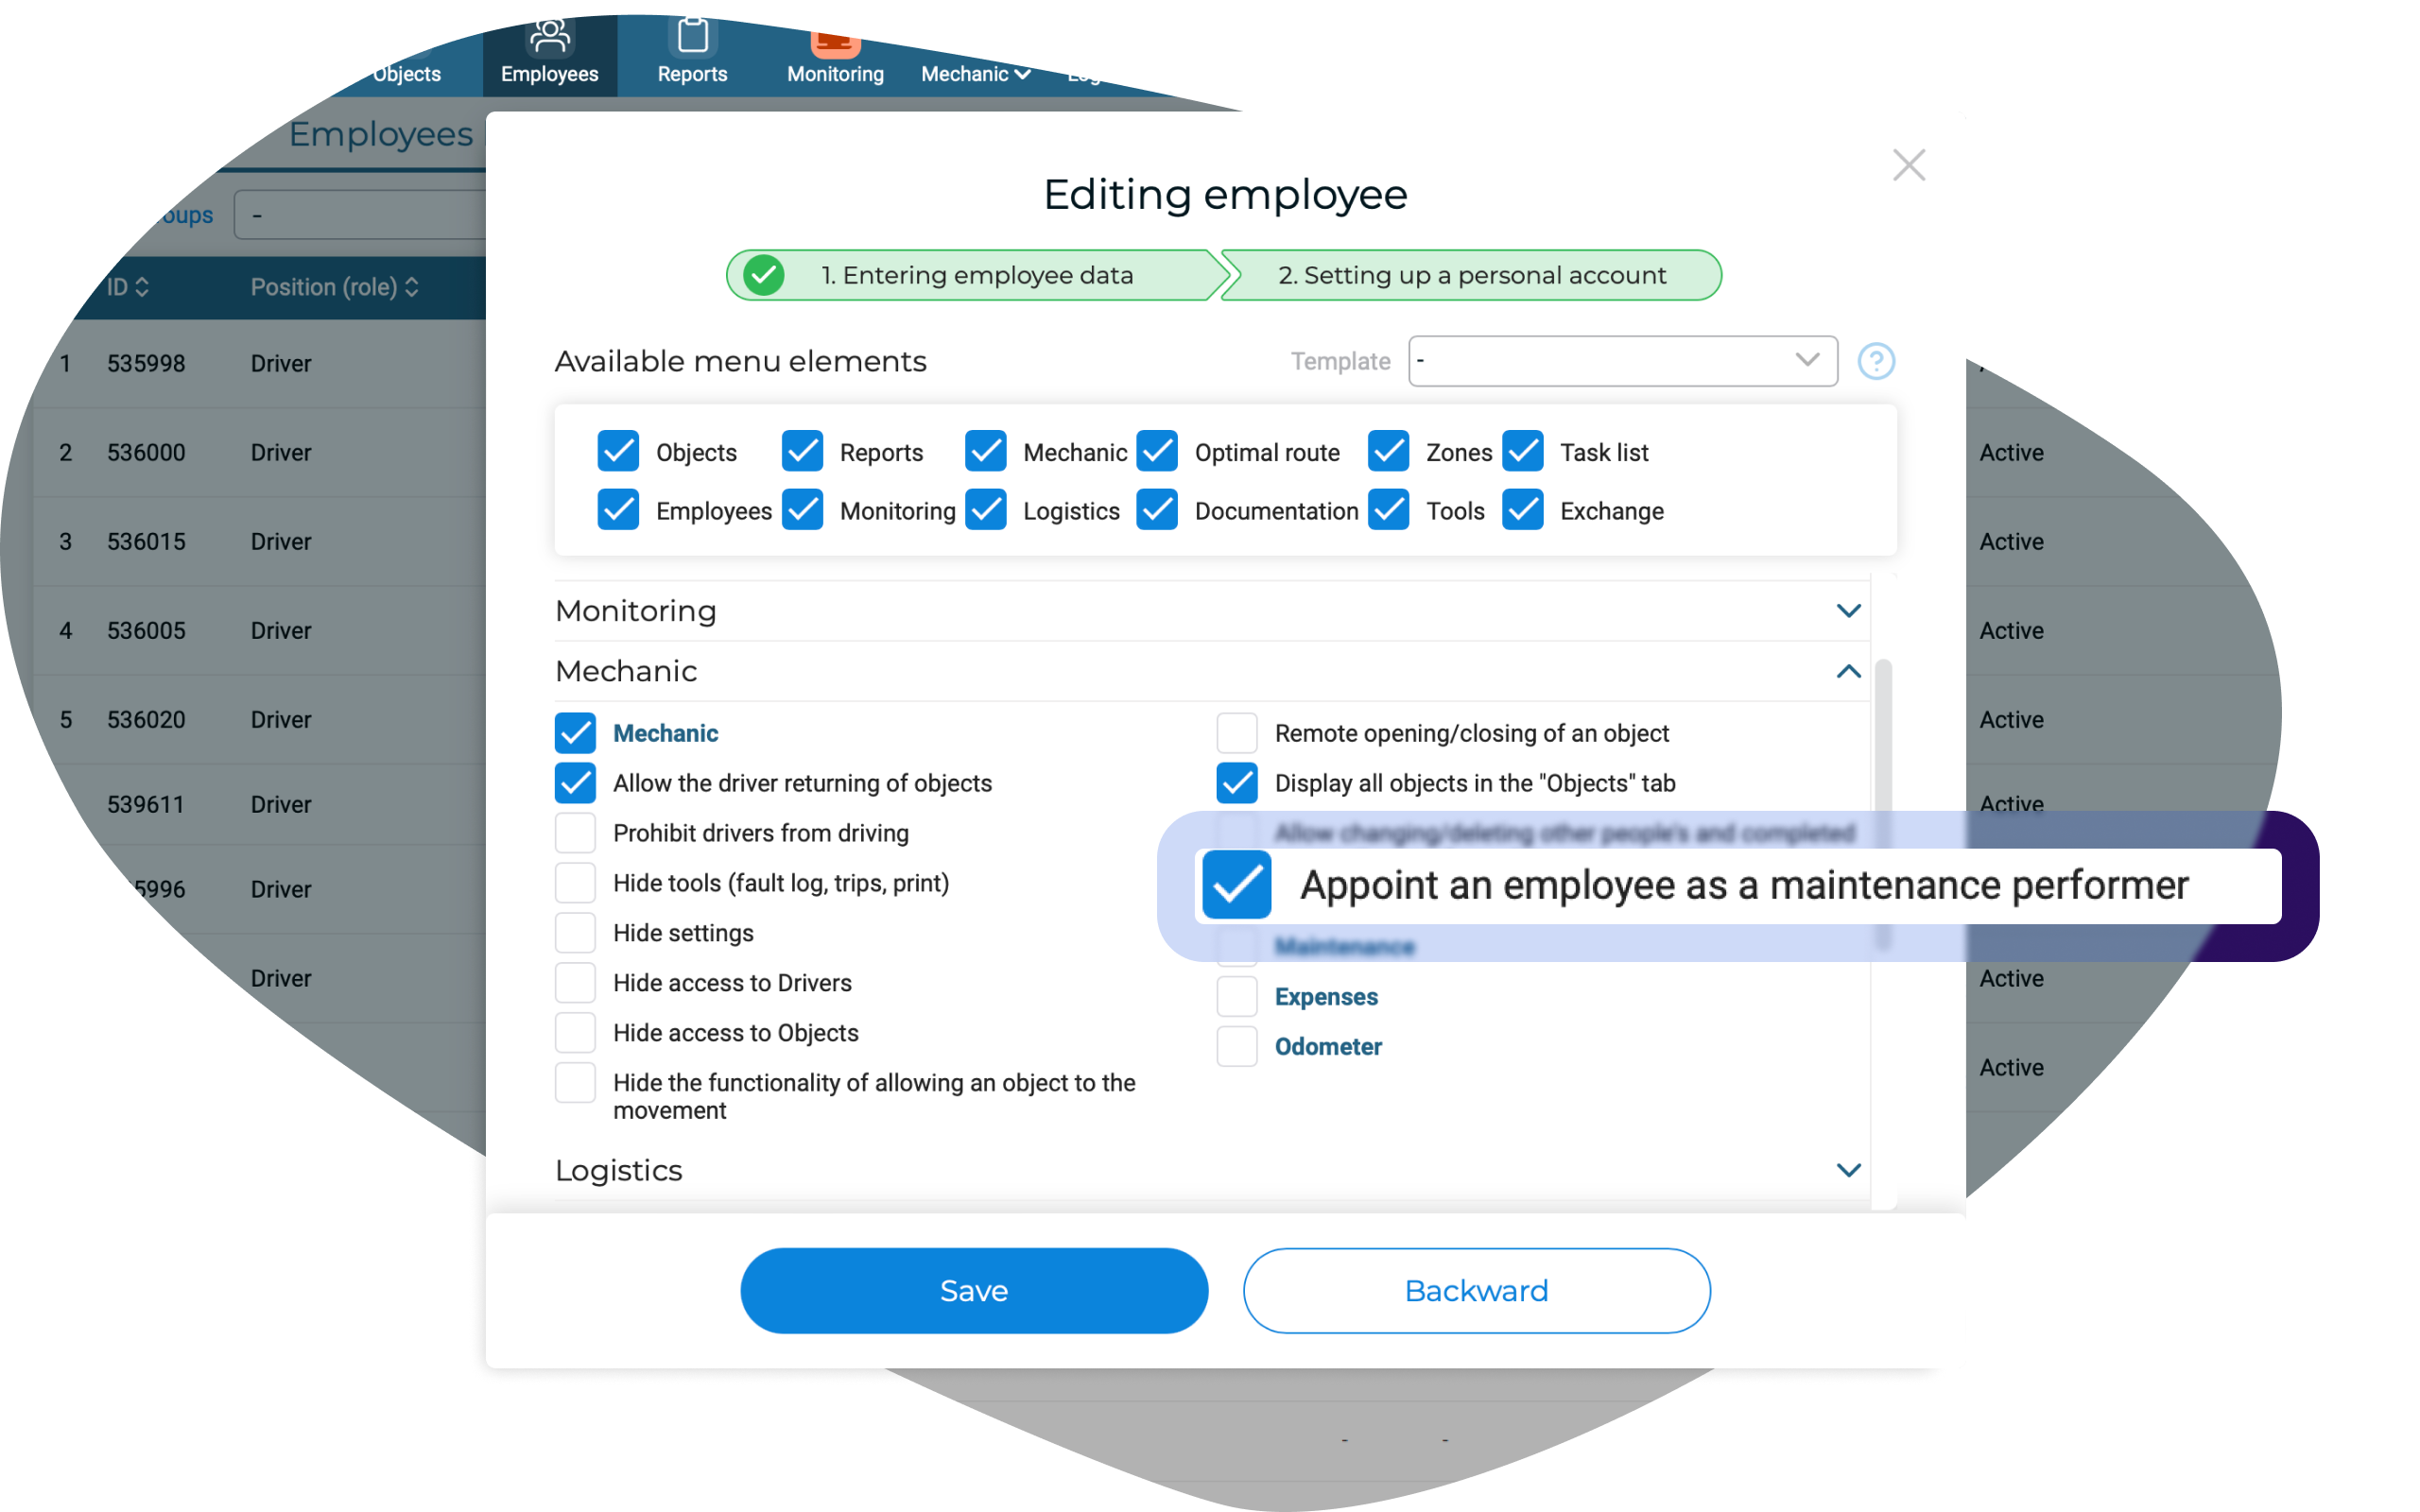
In order for the service station, as well as the employees who performed the repairs, to be displayed in the “Executor” field, it is necessary to create new employees with the appropriate names. In the settings of the personal account of such employees, it is necessary to activate the option “Appoint an employee as a maintenance performer”.
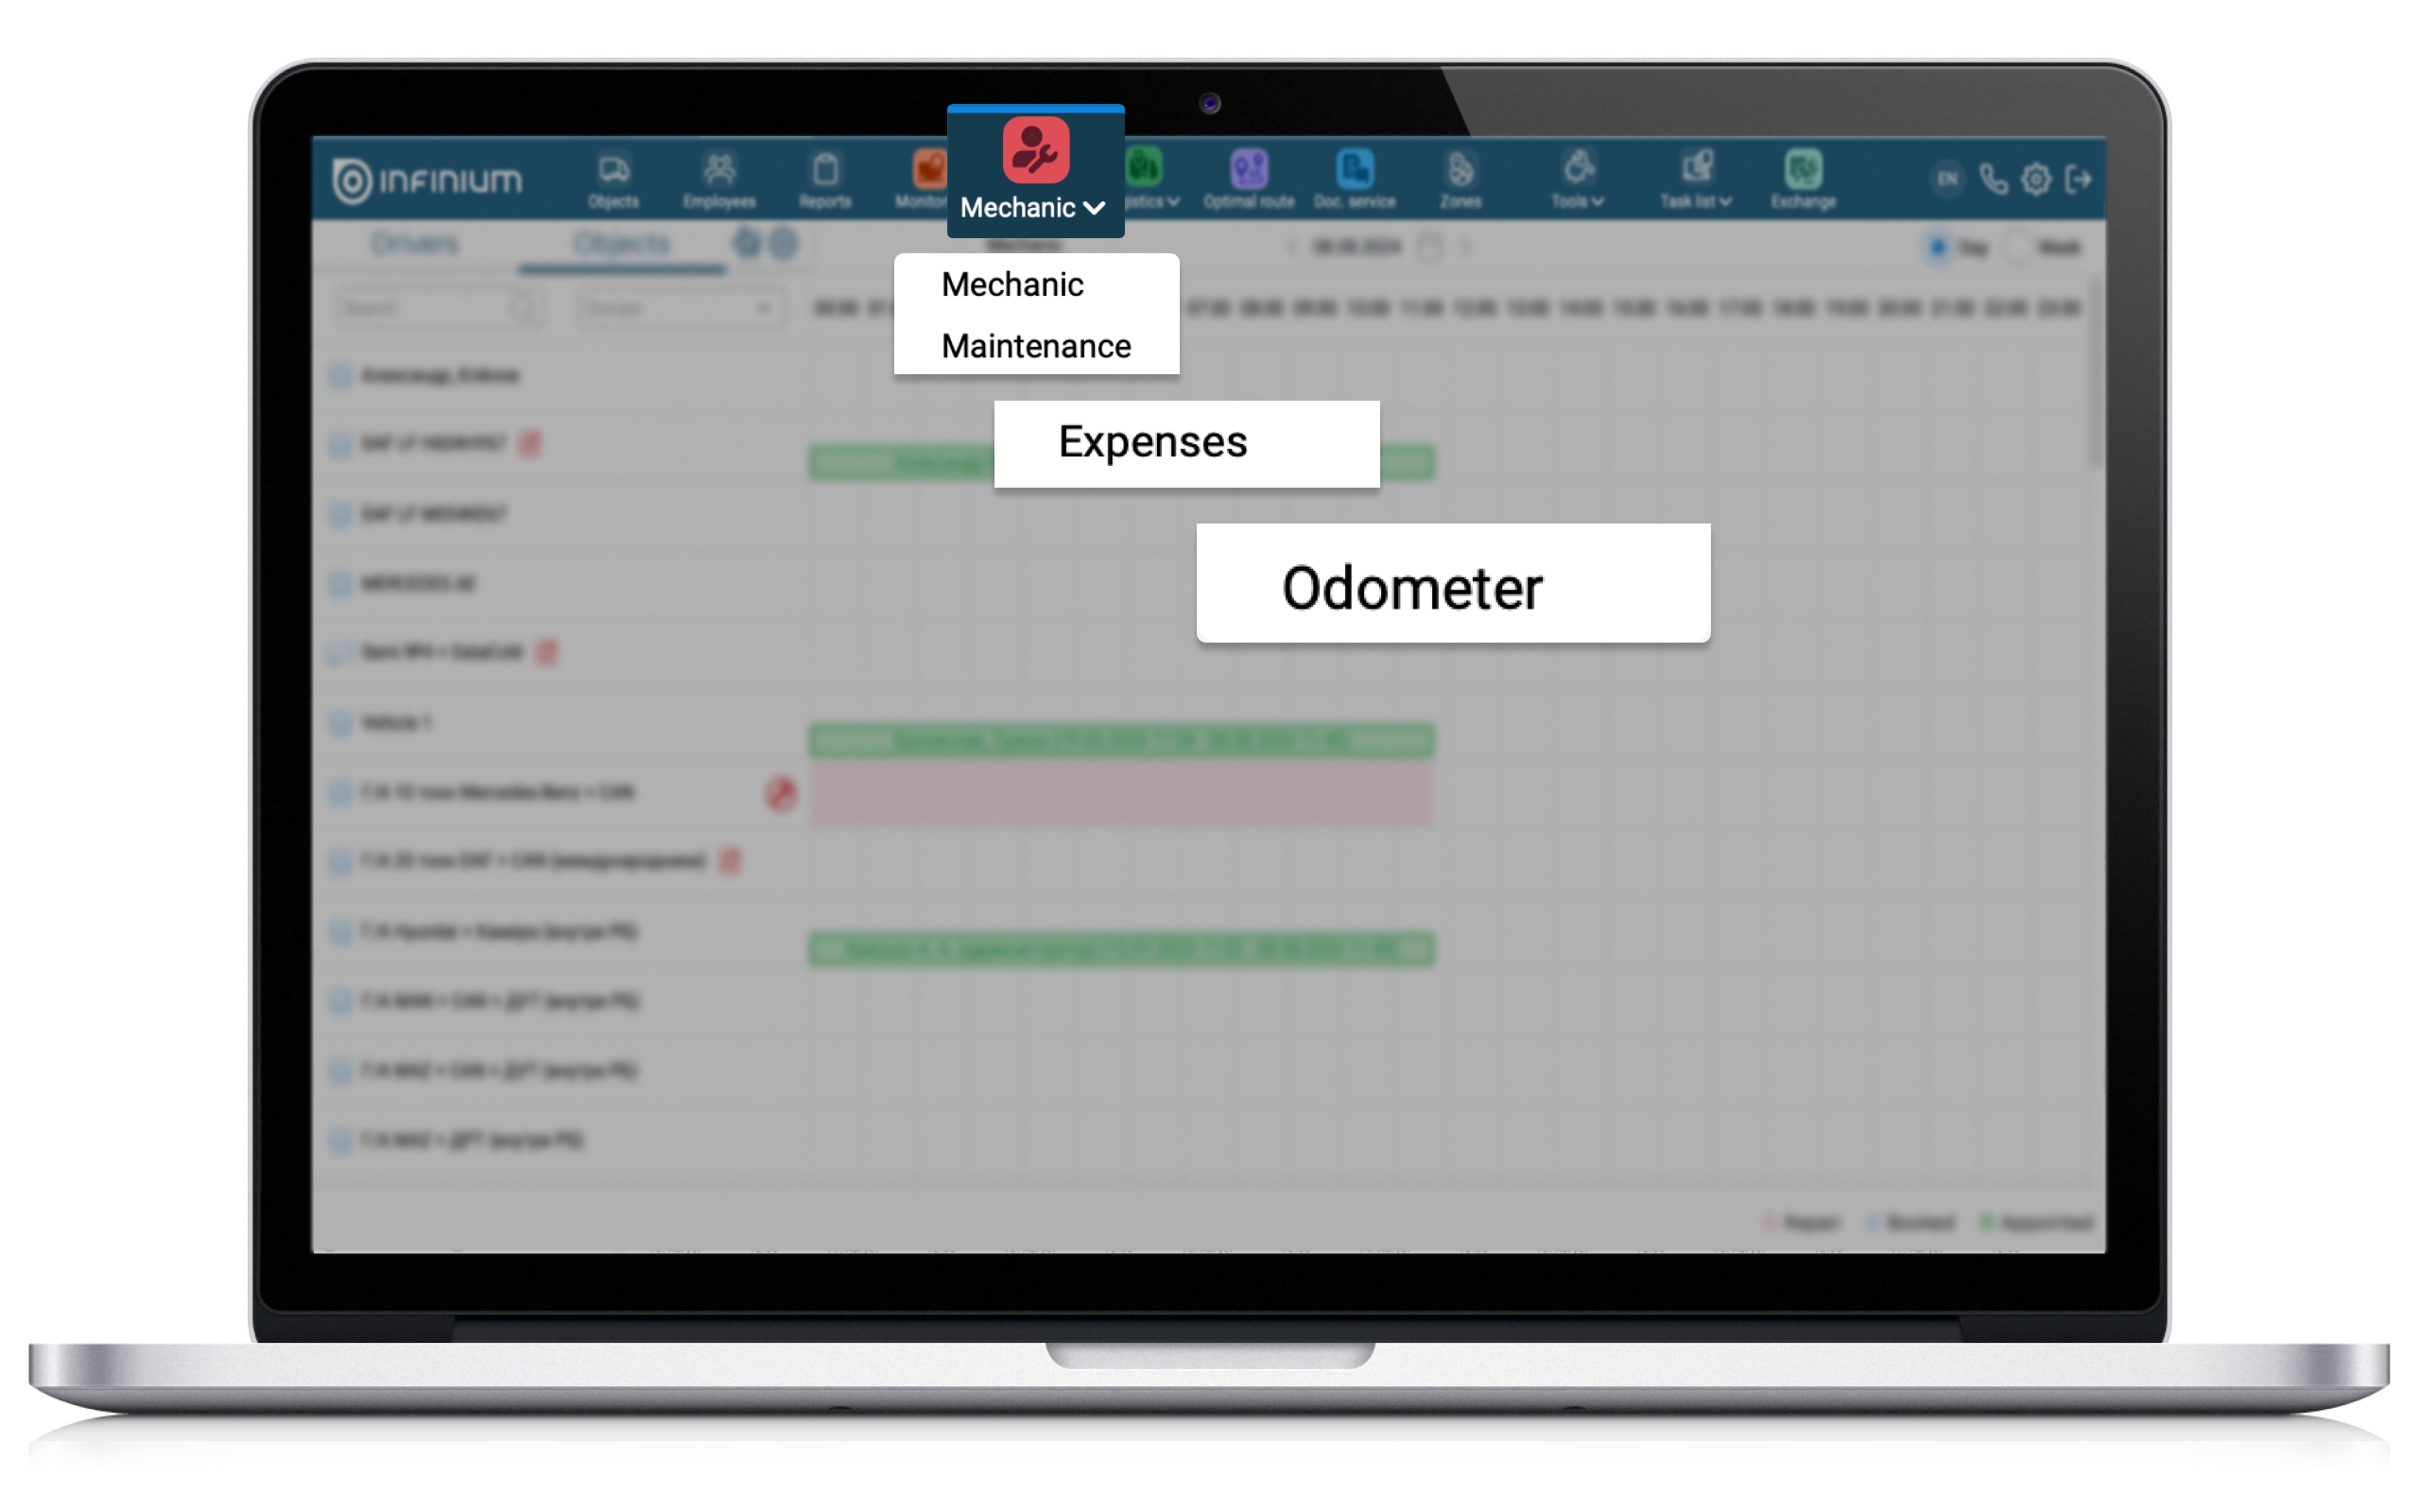
Attention is also paid to such important responsibilities of a mechanic as monitoring the vehicle maintenance, as well as maintaining and viewing up-to-date information on the odometer readings of all vehicles in the fleet. All functionality is conveniently implemented in such subsections of the platform as “Odometer” and “Maintenance”. This will allow the mechanic to view and enter all relevant information in one place; these subsections are also located in the “Mechanic” section.
Significant improvements have been made in the “Expenses” section. Now all maintenance records from the “Maintenance” section, entries from the fault log of the “Mechanic” section are automatically displayed in the “Expenses” section. In the “Expenses” themselves, the ability to record the maintenance contractor and attach reporting documents has been added. We draw the attention of our users that it is not possible to change or delete records added from other sections in the “Expenses” table. This restriction was introduced in order to avoid discrepancies in information in identical records of different sections.
As a result, the head of the company can quickly and conveniently view the financial costs of car servicing for a certain period; understand where repairs are most often carried out: at a service station or on your own, and also compare the cost of the same work and materials at different service stations.
Change for the better with us!